
Infotainment System
Case Study
Overview
Client: Mercedes-Benz AMG
Role: Recruiter, coordinator, moderator/interviewer
Dates: September 2024
Setting: In-person research
Tools: Figma, Google Sheets, Google Docs
Research Question
How does the information architecture and interaction design of the AMG infotainment system impact driver experience, perceived safety, and confidence during use?
Why This Study Matters
The AMG infotainment system is a critical interface used in high-attention, time-sensitive driving contexts. Poor usability does not merely reduce satisfaction, it increases cognitive load and may have potential safety risks. This study focused on identifying early usability risks and opportunities to improve clarity, safety, and trust.
Success Criteria:
Success was defined as minimal amounts of interaction with the system in order to achieve desired goal and low perceived cognitive load during tasks.
What was NOT studied:
This study did not evaluate long-term learning effects or quantify glance-time metrics while driving, both of which are recommended for future validation.
Research Approach
Methodology & Structure
This was a formative, moderated qualitative research study combining:
1-hour Focus groups (to surface expectations, mental models, and attitudes)
30-minute Moderated, task-based usability testing on the vehicle’s central display console
30-minute In-depth interviews (IDI)
Methodology Rationale
This study focused on formative usability evaluations within a simulated testing environment. Given the exploratory nature of the research and the focus on identifying points of friction in frequently used, driving-related tasks, the study emphasized qualitative observation, task flow analysis, and participant feedback over instrumented performance metrics.
Why Formative?
The goal was to identify usability risks early, before refinement or large-scale rollout.
Participants
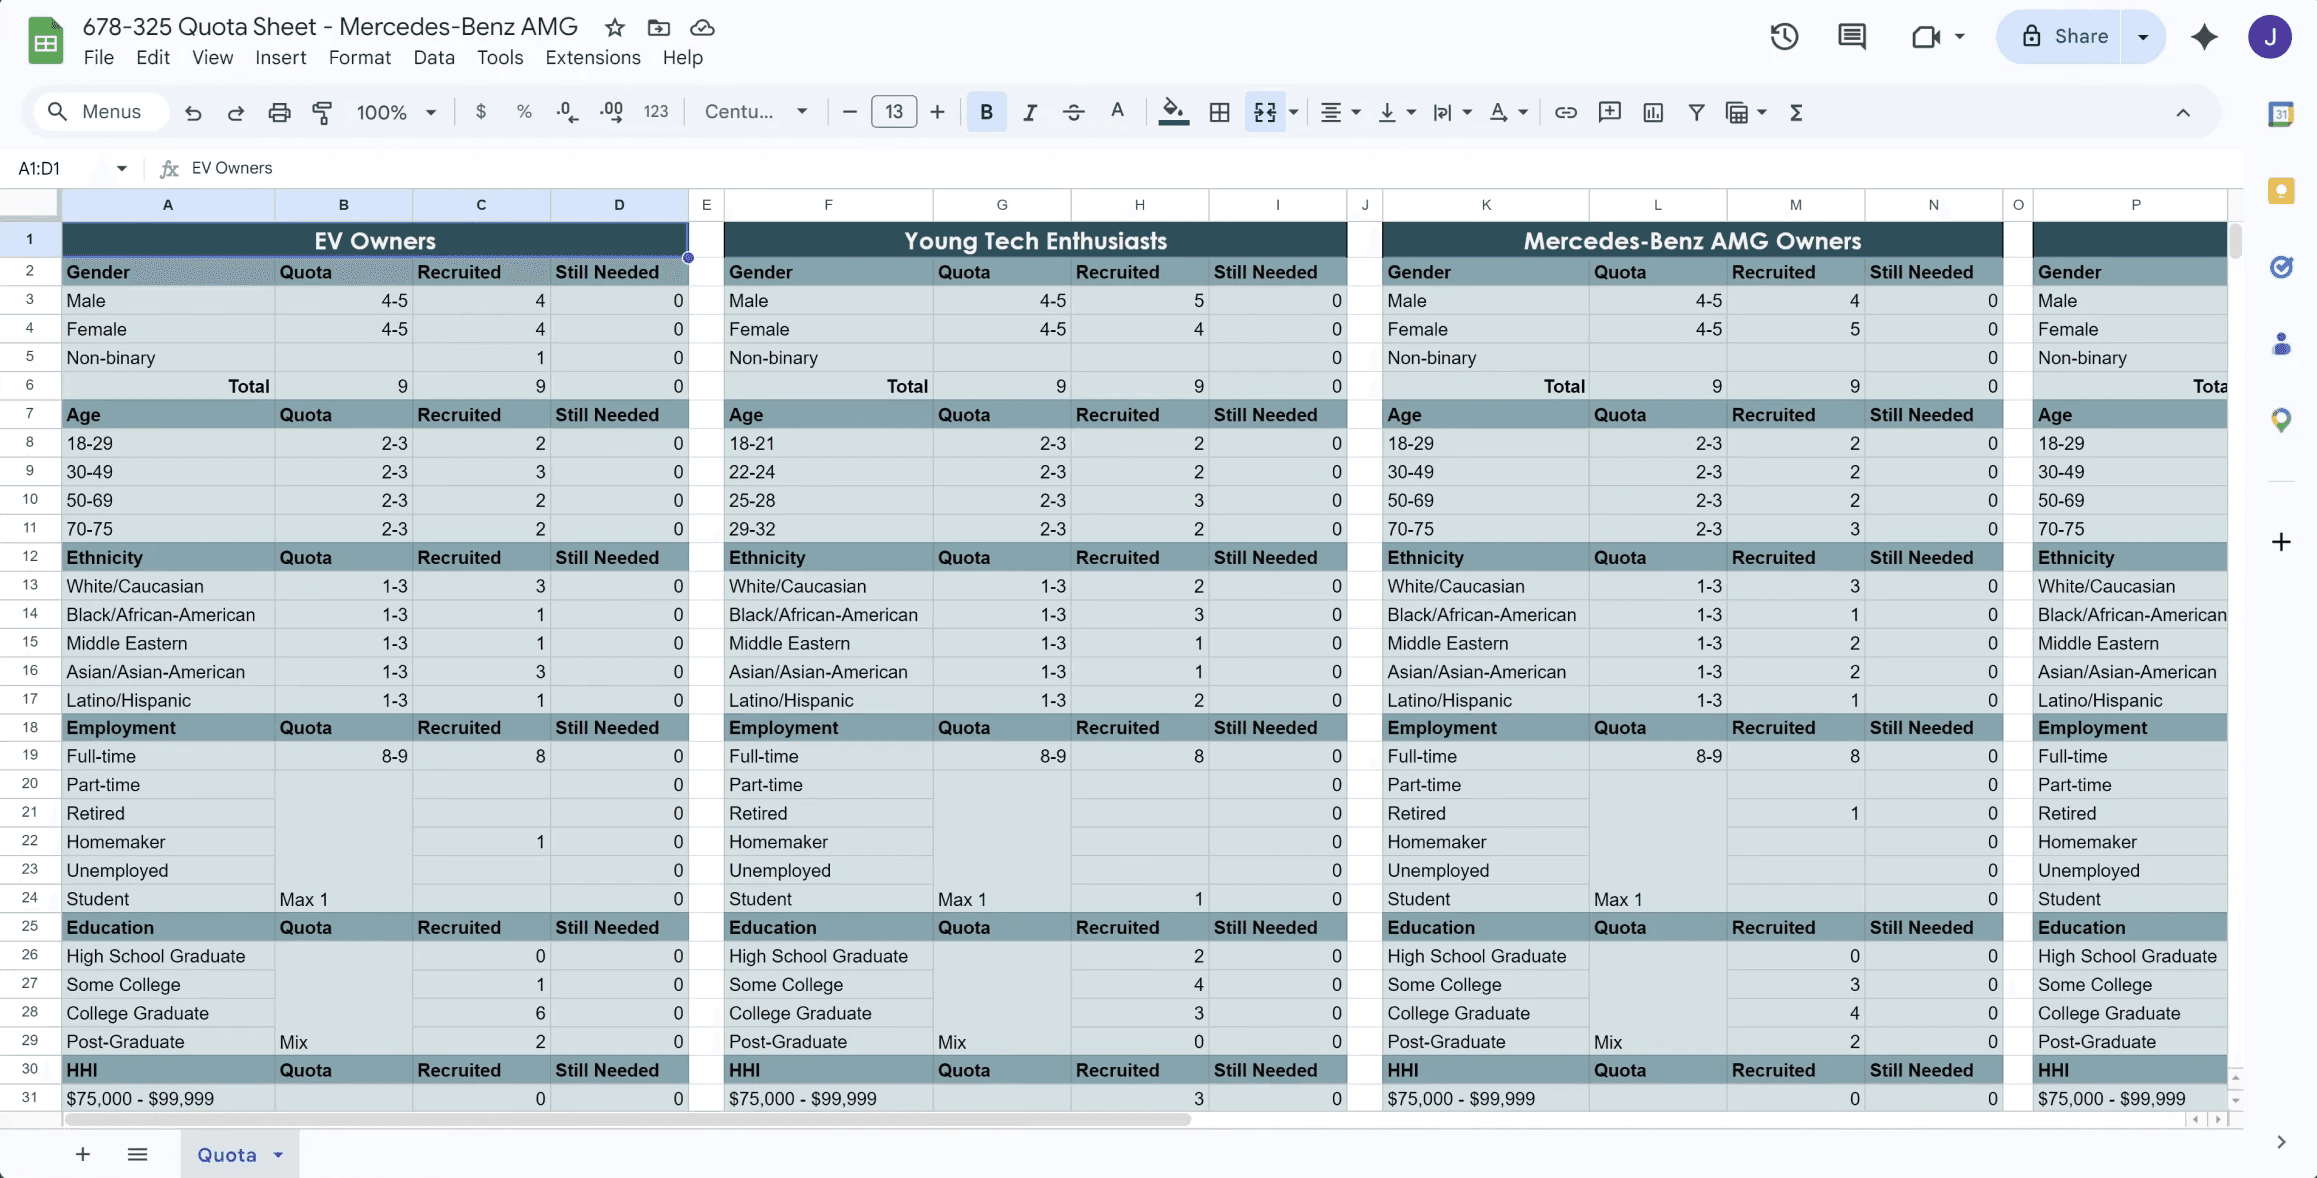
Total Participants: Recruited 45 to seat 40
Focus Groups: 5 groups of 8 participants
Segments Represented:
Group 1:
Electric vehicle owners
Group 2:
Young technology enthusiasts
Group 3:
Mercedes-Benz AMG owners
Group 4:
Competitor owners (BMW, Audi, Lucid, Porsche, Tesla)
Group 5:
Mix of previous 4 groups
Demographics:
Gender: Aimed for a 50/50 mix
Age Range: 18–75
Ethnicity: Recruited a mix
Minimum n = 8 Black/African American respondents
Minimum n = 8 Latino/Hispanic respondents
Minimum n = 8 Asian/Asian-American respondents
Minimum n = 8 Middle Eastern respondents
Minimum n = 8 White respondents
Minimum n = 5 Additional respondents from any ethnic backgrounds
Education: High school graduates and higher
HHI: Single Income: $75K+; Dual Income: $150K+, recruited a range
Employment:
None that currently or previously worked in related industries (market research, automotive industry)
Homemaker, retired, part-time employed, and/or student (Max n = 1 per group)
Eligibility Criteria:
All must be primary or shared financial decision-makers
Familiarity with modern in-vehicle infotainment systems
Qualifying vehicle year must be 2020 or newer
Additional Criteria:
Past Participation: None to have participated in market research within the past 3 months; none to have participated in automotive research in the past 6 months
Willing to sign a respondent waiver agreement and NDA
Willing to show proof of active drivers license, vehicle registration, and insurance for qualifying vehicle
Usability Tasks
Participants completed realistic driving-related tasks designed to evaluate interaction cost and discoverability:
Identify AMG specific apps
Change between driving modes
Locate vehicle status information
Change EV charging settings
Analysis
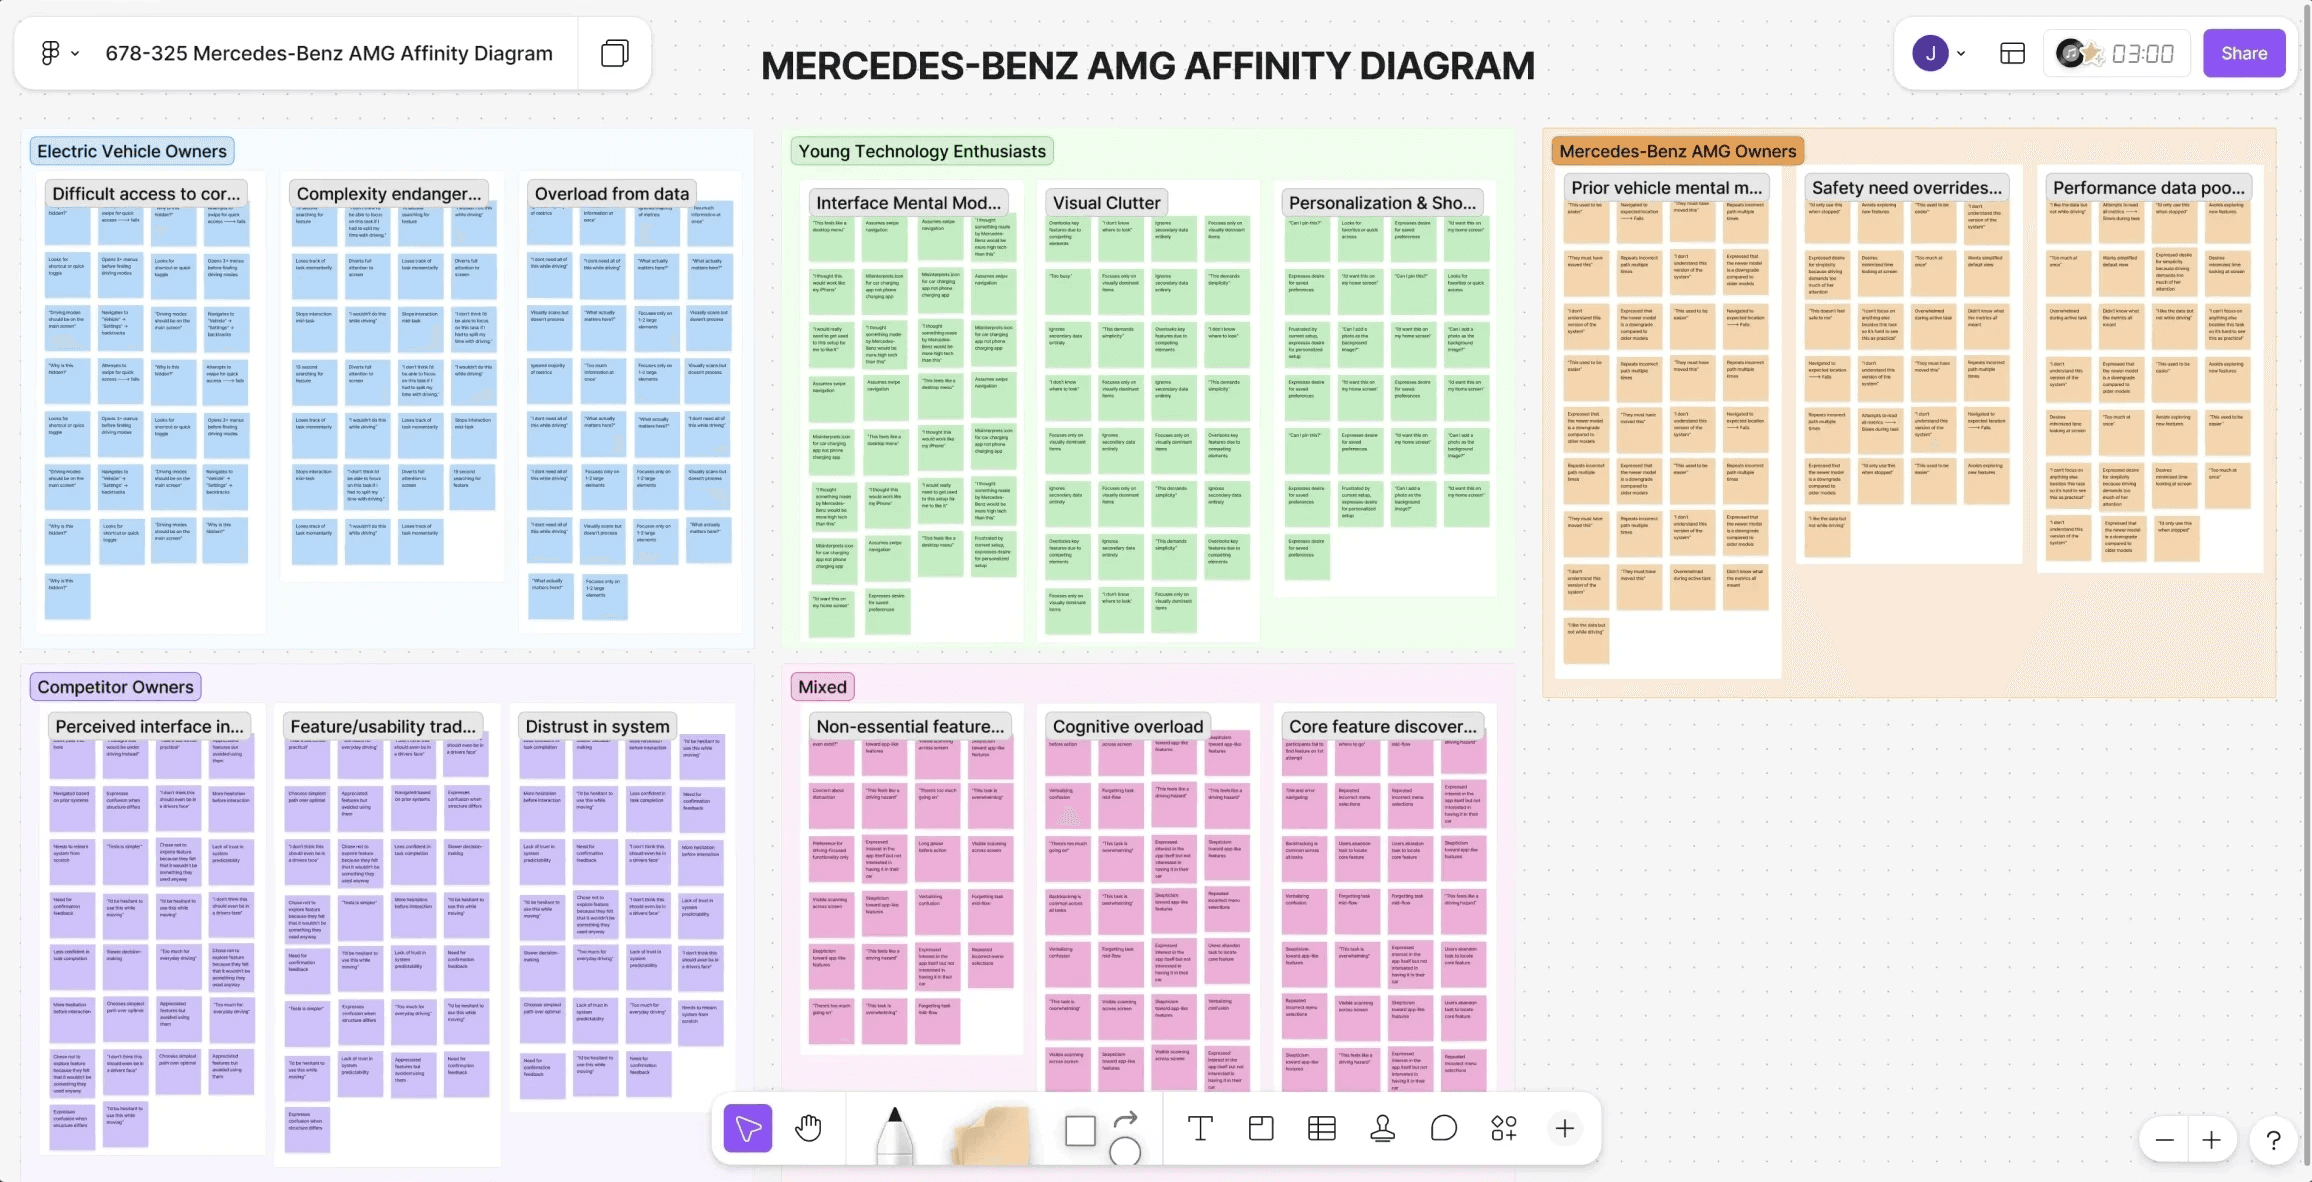
Data was synthesized using:
Tagging and taxonomy development
Qualitative coding
Affinity Diagramming
Patterns were analyzed across segments to identify systemic usability issues rather than individual preferences.
A mixed deductive and inductive approach was used to validate predefined usability hypotheses while remaining open to emergent behavioral patterns.
Key Findings & Insights
1. Poor Information Architecture
Observation:
Participants struggled to locate essential driving functions due to a mismatch between their mental models and the system’s information architecture. Core features were often buried within unclear categories or labeled in ways that did not align with driver expectations.
UX Interpretation:
When information architecture conflicts with user mental models, interaction cost increases, especially in time sensitive driving scenarios. Drivers are forced to allocate cognitive resources toward using the system rather than driving. In a high-risk context, even minor friction erodes perceived system reliability and user confidence.
Recommendation:
Simplify navigation hierarchy and improve feature grouping based on validated driver mental models
Standardize iconography and labels using established automotive conventions
Prioritize core driving functions within primary navigation layers
2. Overwhelming Information Density
Observation:
Performance screens displayed excessive data optimized for expert AMG users. The volume of metrics created visual clutter, making it difficult for average drivers to identify the most relevant information quickly.
UX Interpretation:
Driving is a cognitively demanding task. When information density exceeds mental processing capacity, users experience cognitive overload. Rather than enhancing control, excess data fragments attention and increases distraction risk. Clarity drives confidence in high attention environments.
Recommendation:
Reduce information density and establish clear visual hierarchies
Emphasize primary metrics while progressively disclosing advanced data
Design contextual displays that surface only task-relevant information
3. Preference Toward Personalization
Observation:
Participants expressed strong preference for customization and an adapted system. Personalization was viewed not merely as an aesthetic enhancement, but as a way to reduce friction and quickly access frequently used features.
UX Interpretation:
Familiarity reduces cognitive effort. When interfaces reflect user habits and learned behaviors, interaction becomes automatic rather than effortful. Adaptive structures increase perceived control, shorten task time, and strengthen trust. Particularly in environments where attention is limited.
Recommendation:
Introduce user profiles that surface high-frequency actions
Provide one-touch access to commonly used driving functions
Implement adaptive layouts that respond to usage patterns while maintaining consistency
4. Resistance to Non-Essential Apps
Observation:
Participants were skeptical of an app-store model within the vehicle. Many voiced concern that non-driving related applications could introduce distraction and dilute the system’s purpose.
UX Interpretation:
In safety-critical environments, users evaluate features through a risk lens. Perceived “non-essential” functionality undermines trust and shifts the system from purpose-built tool to potential distraction. Relevance and restraint signal safety and design intentionality.
Recommendation:
Prioritize purpose-built, vehicle-specific functionality
Establish strict guidelines for third-party integrations
Explore adaptive systems that prioritize features based on driving context and safety constraints
Ethical Considerations
Informed consent obtained
Voluntary participation
Data anonymized
Impact & Takeaways
This study identified critical usability and safety risks within the AMG infotainment system related to discoverability, cognitive load, and interaction cost. Addressing these issues presents an opportunity to:
Improve driver confidence and satisfaction
Reduce distraction and safety related risks
Strengthen trust in AMG’s performance-focused brand promise
What I’d Do Next
Validate revised navigation models through iterative usability testing
Conduct glance-time and workload assessments for high-risk interactions
Perform quantitative metric focused research while operating vehicle